Intel FPU Error Scatter Plots
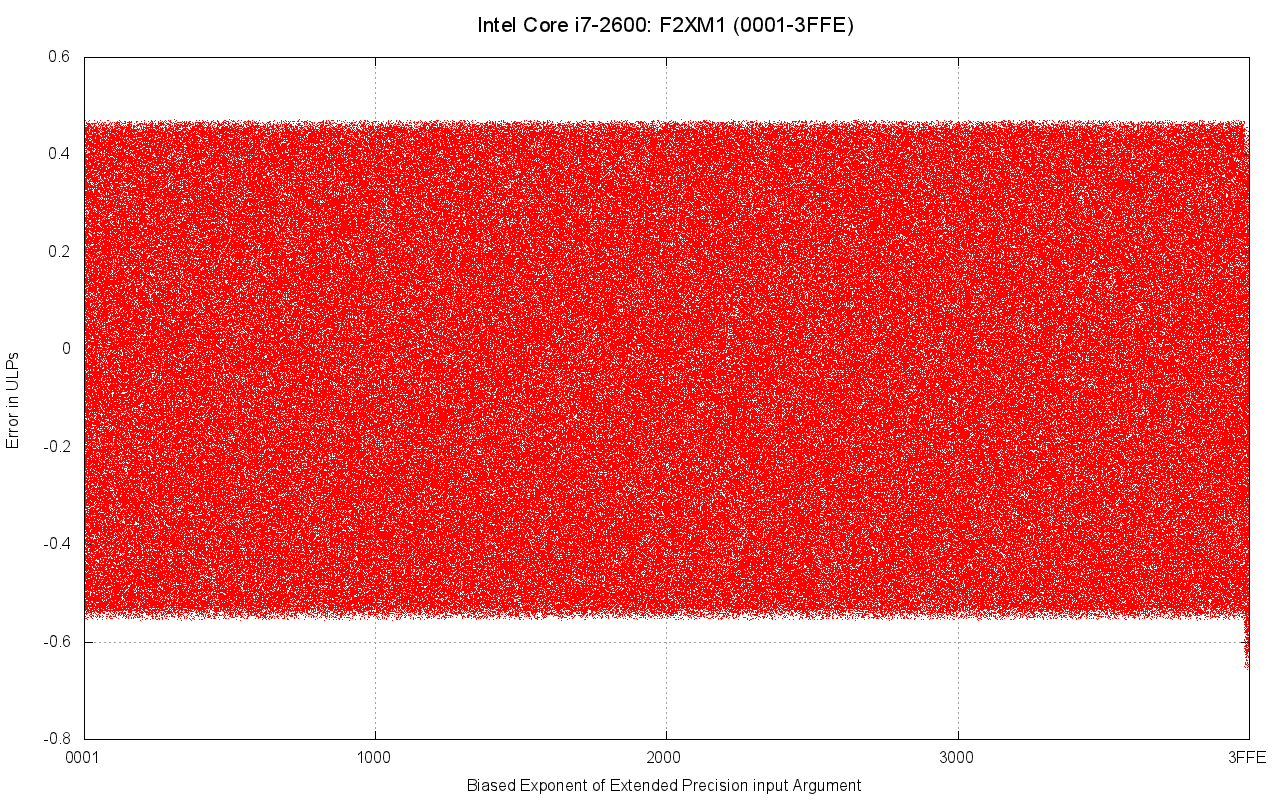
F2xm1 plot for arguments < 1.0. No failures were found for the f2xm1 instruction.
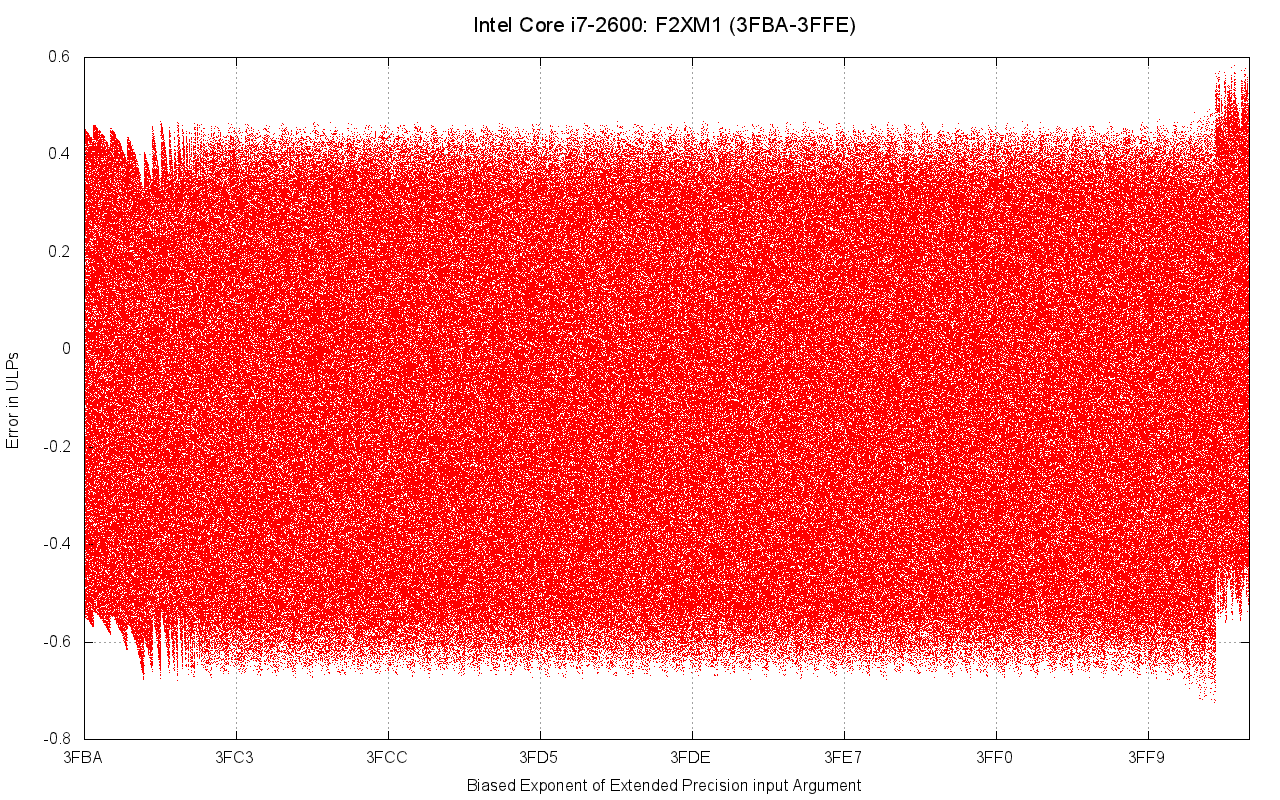
F2xm1 plot zoomed in on arguments near 1.0.
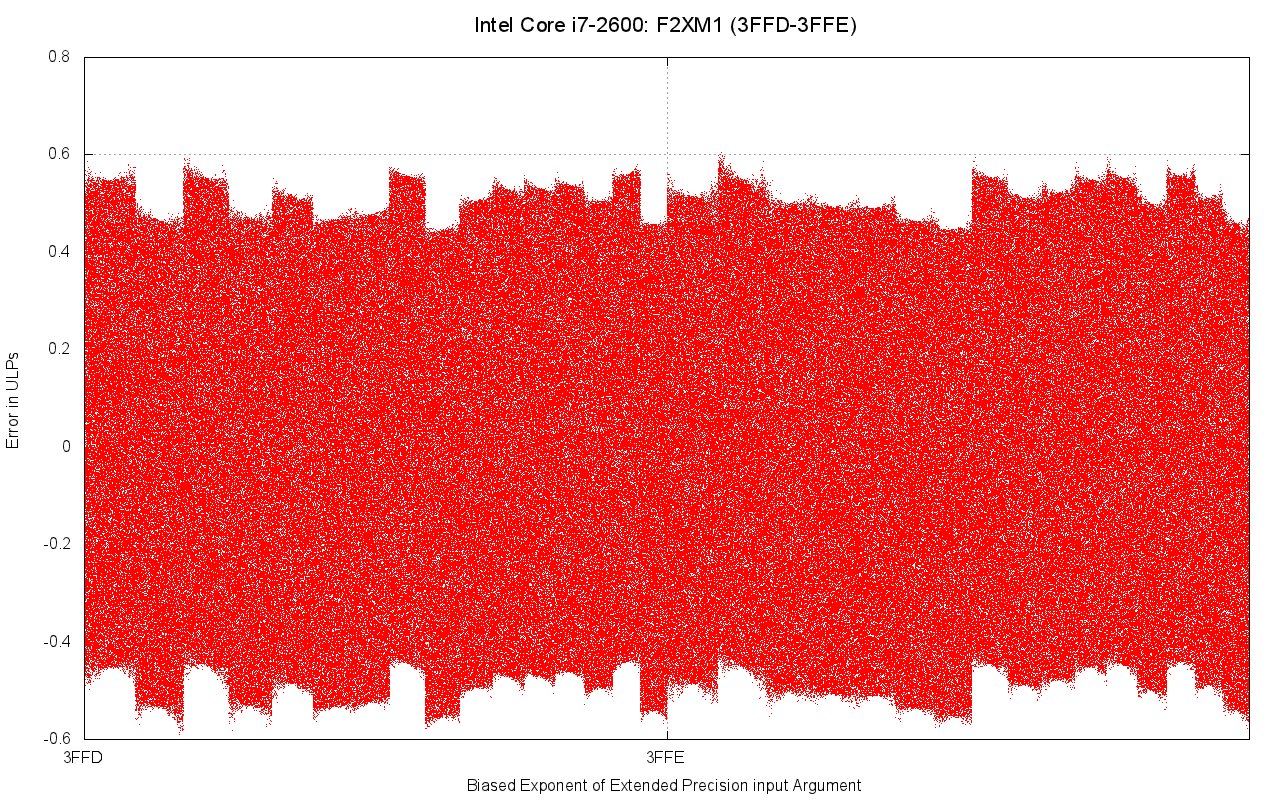
More detail of f2xm1 for arguments near 1.0.
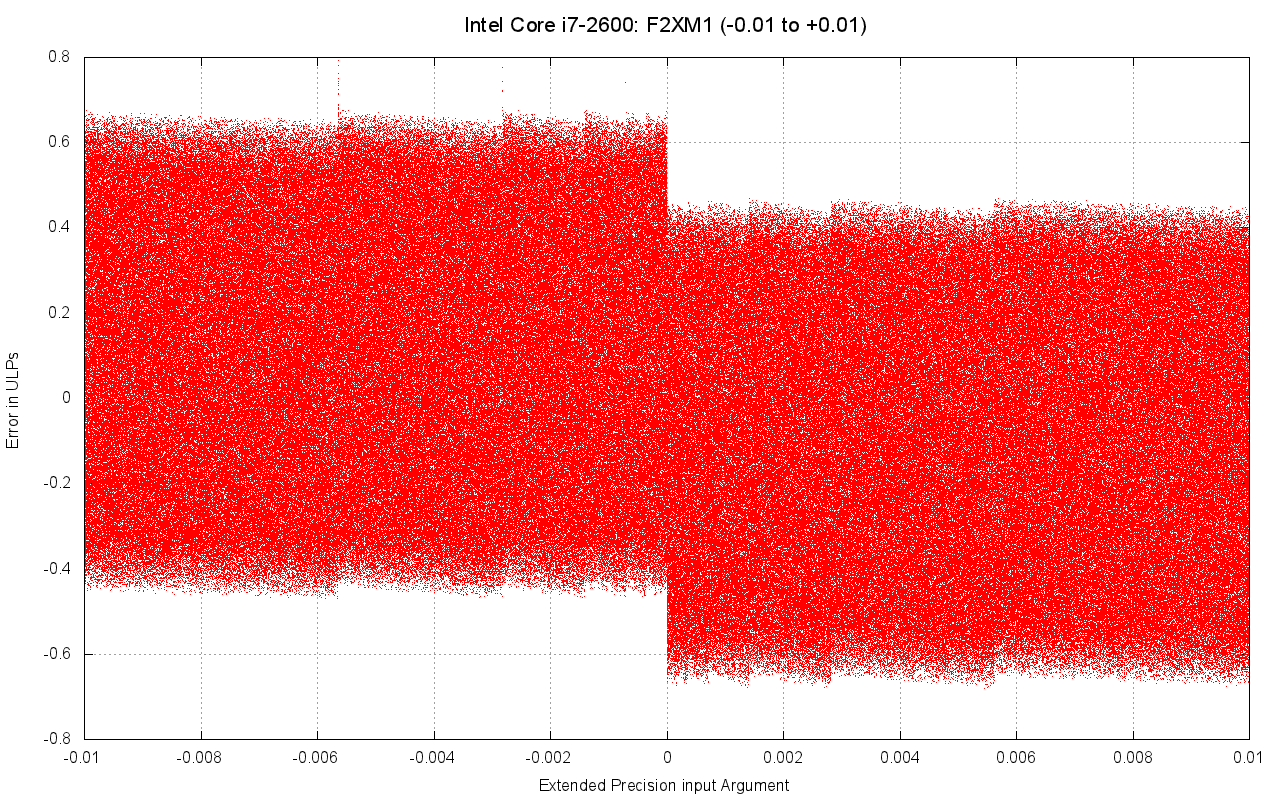
F2xm1 for arguments near 0.

F2xm1, entire argument range.
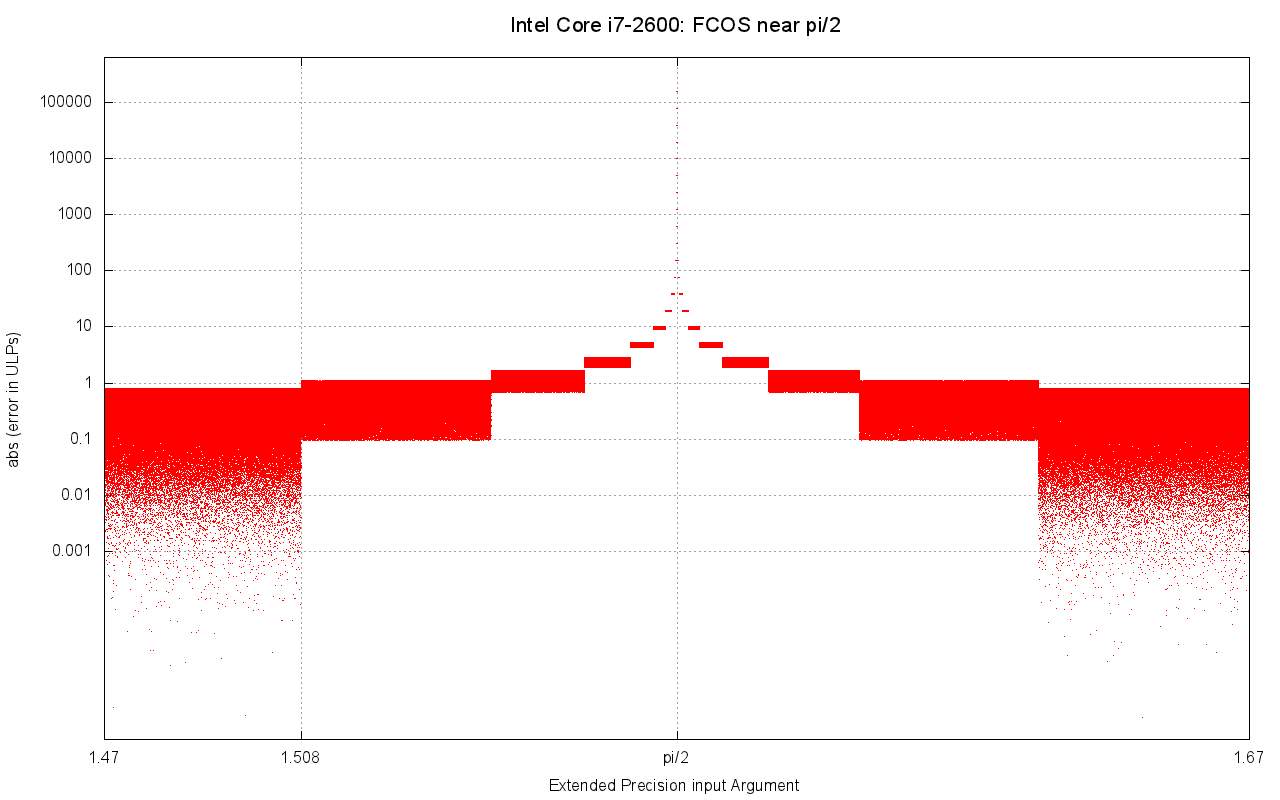
Fcos plot showing large errors as the argument approaches pi/2. Errors exceeding the one ulp specification start at argument ~1.508 radians.
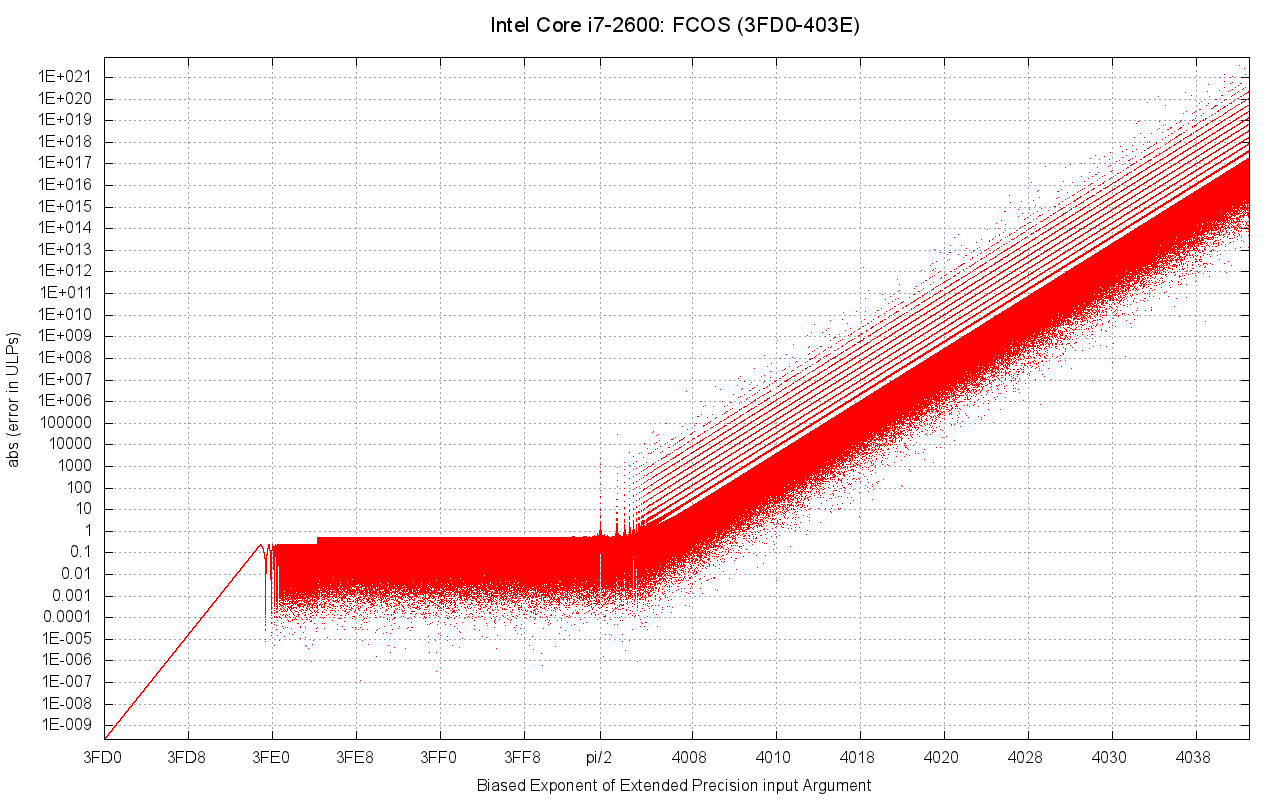
Fcos plot for the entire argument range. The upward sloping portion shows the effect of the processor's imperfect argument reduction.
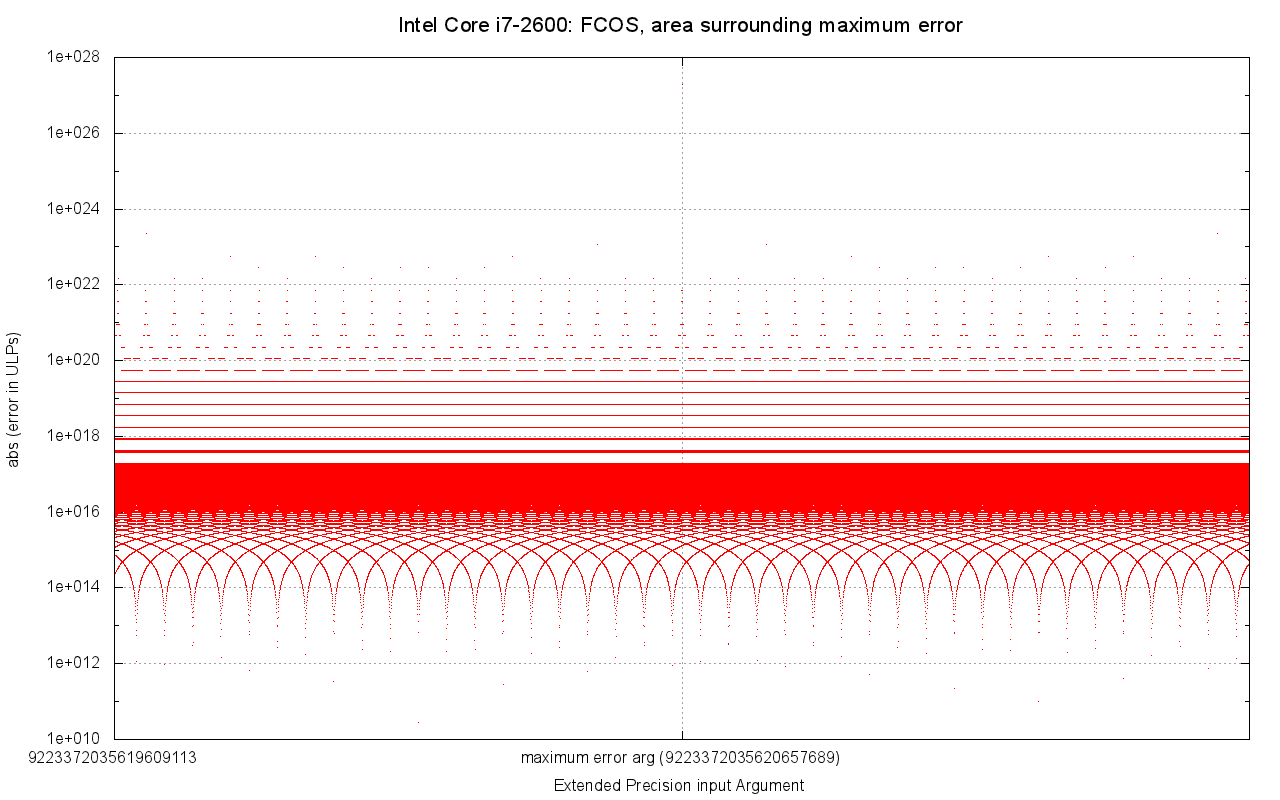
Fcos plot showing largest known error.
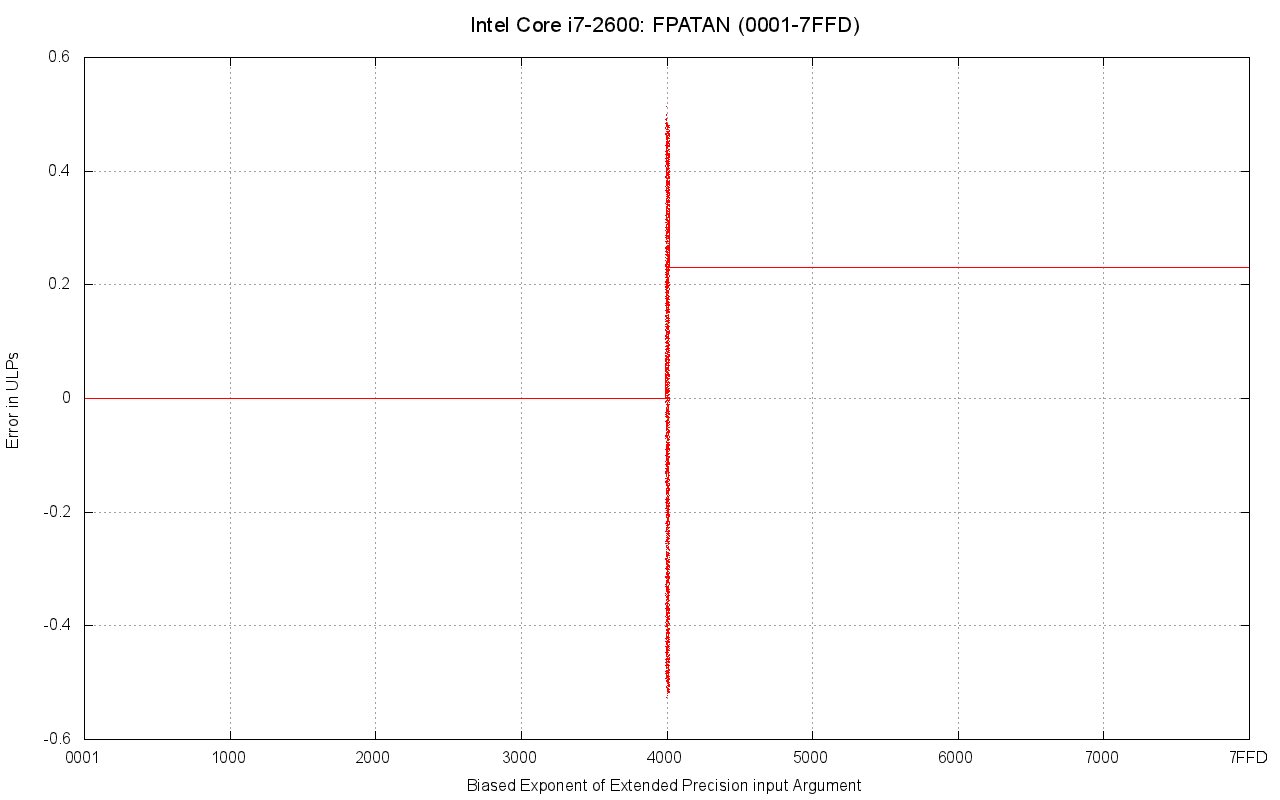
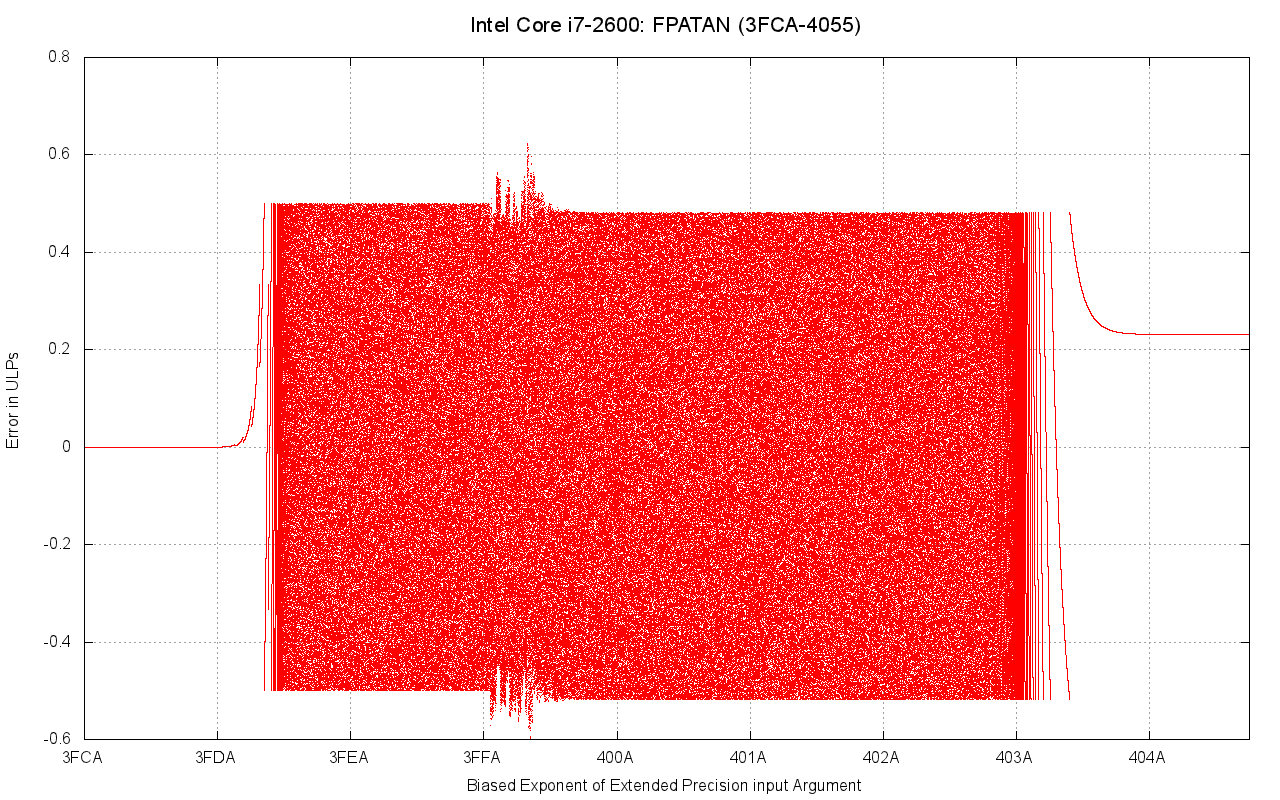
Fpatan plot covering the entire argument range. No failures were found for the fpatan instruction.
Fpatan plot zoomed in on argument range where the error value fluctuates.
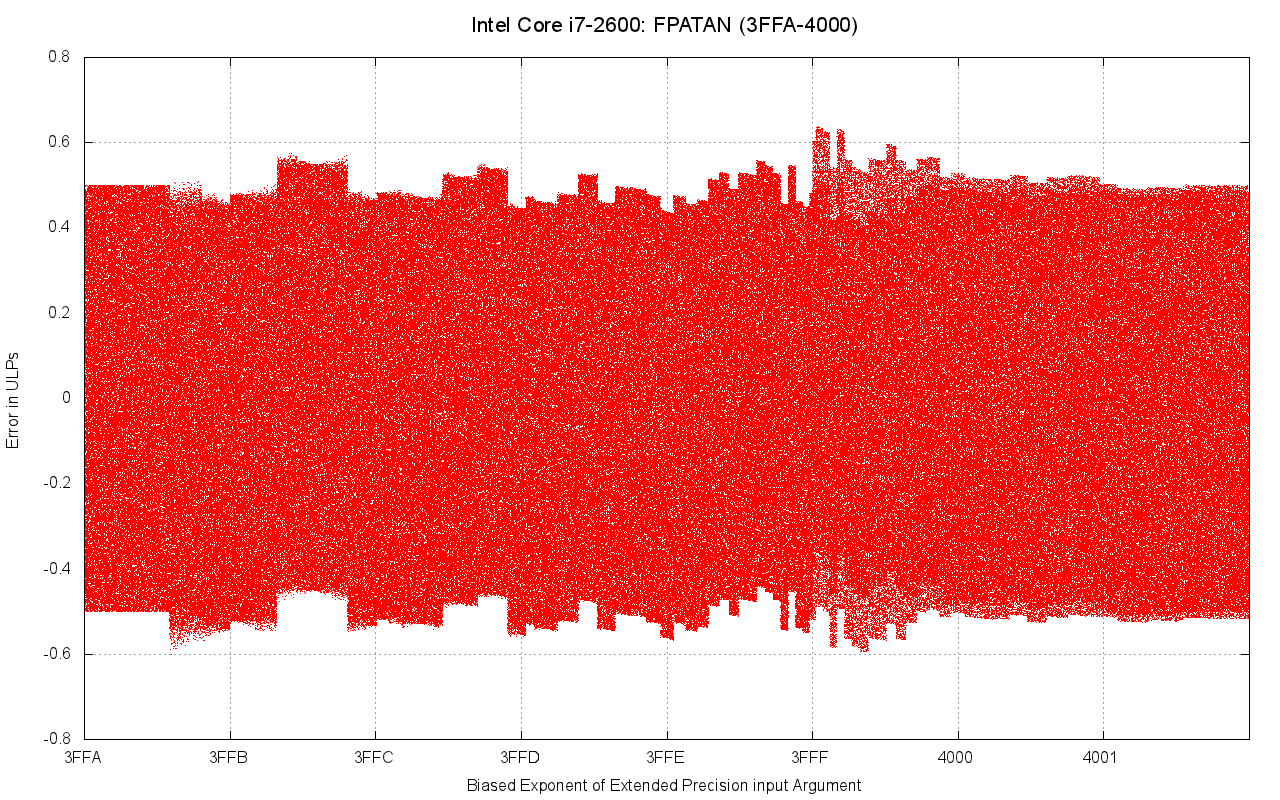
Fpatan plot zoomed in on the range of maximum error.
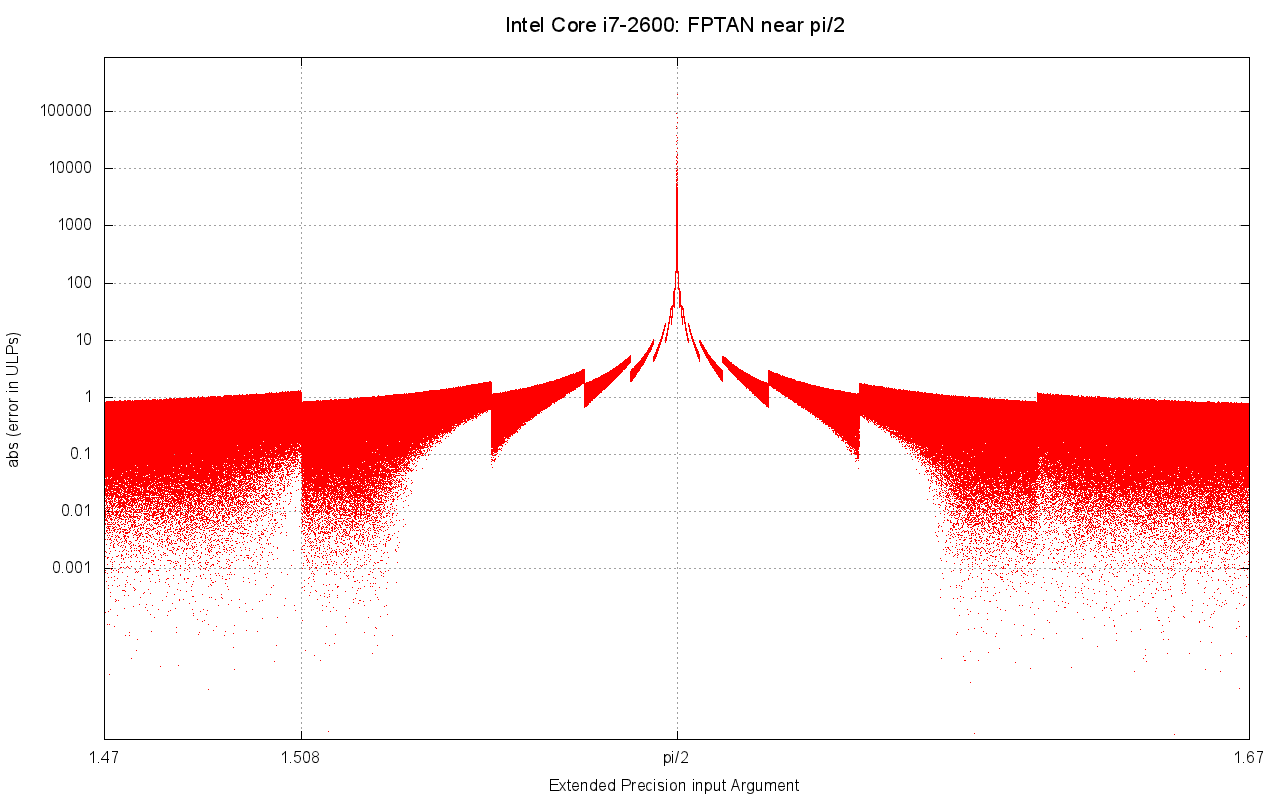
Fptan plot showing large errors as the argument approaches pi/2. Errors exceeding the one ulp specification start at argument ~1.508 radians.
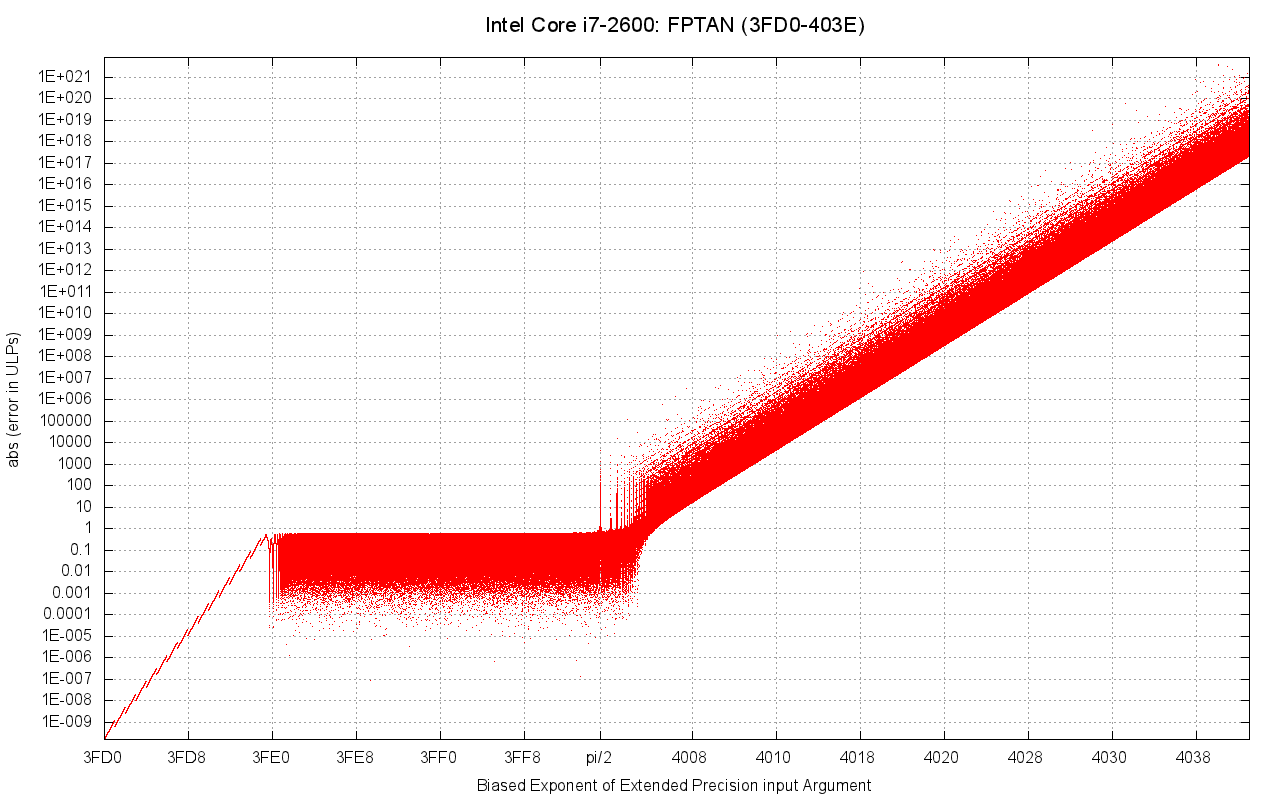
Fptan plot for the entire argument range. The upward sloping portion shows the effect of the processor's imperfect argument reduction.
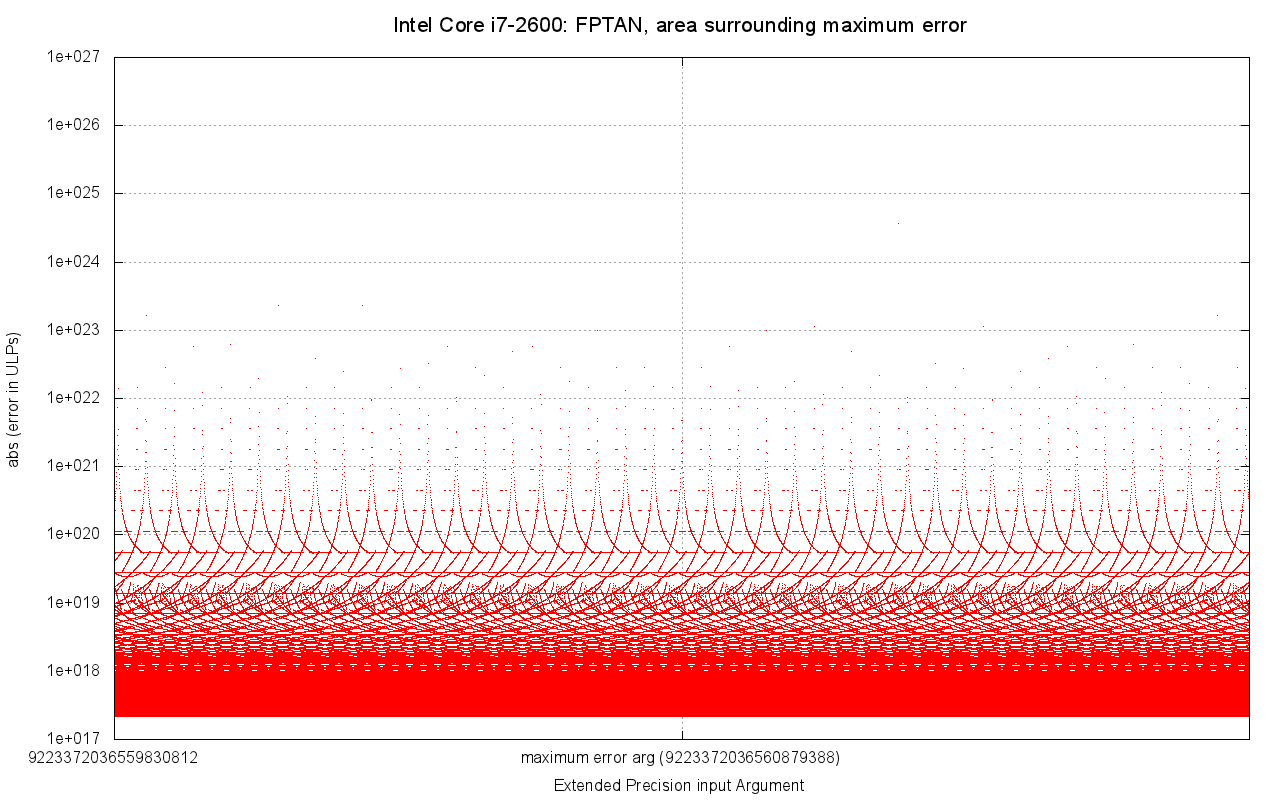
Fptan plot showing largest known error.
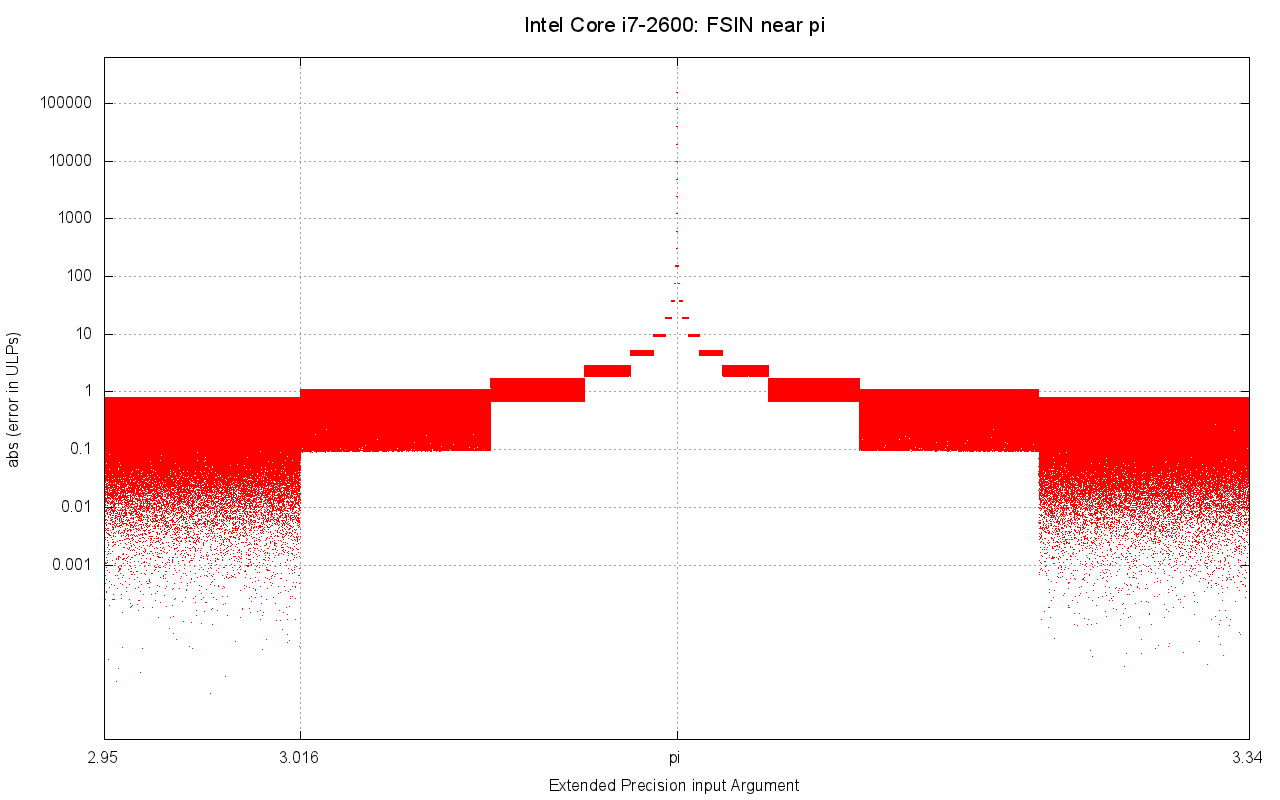
Fsin plot showing large errors as the argument approaches pi. Errors exceeding the one ulp specification start at argument ~3.016 radians.
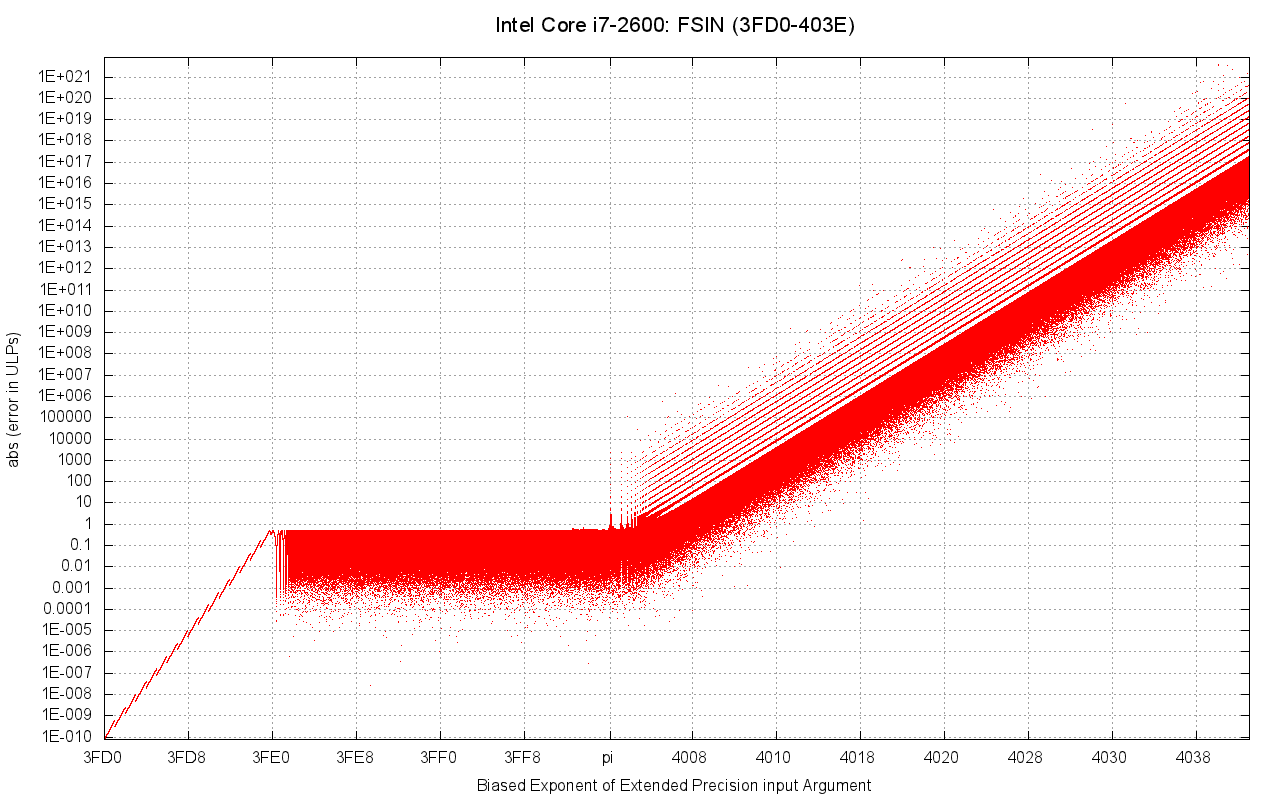
Fsin plot for the entire argument range. The upward sloping portion shows the effect of the processor's imperfect argument reduction.

Fsin plot showing largest known error.
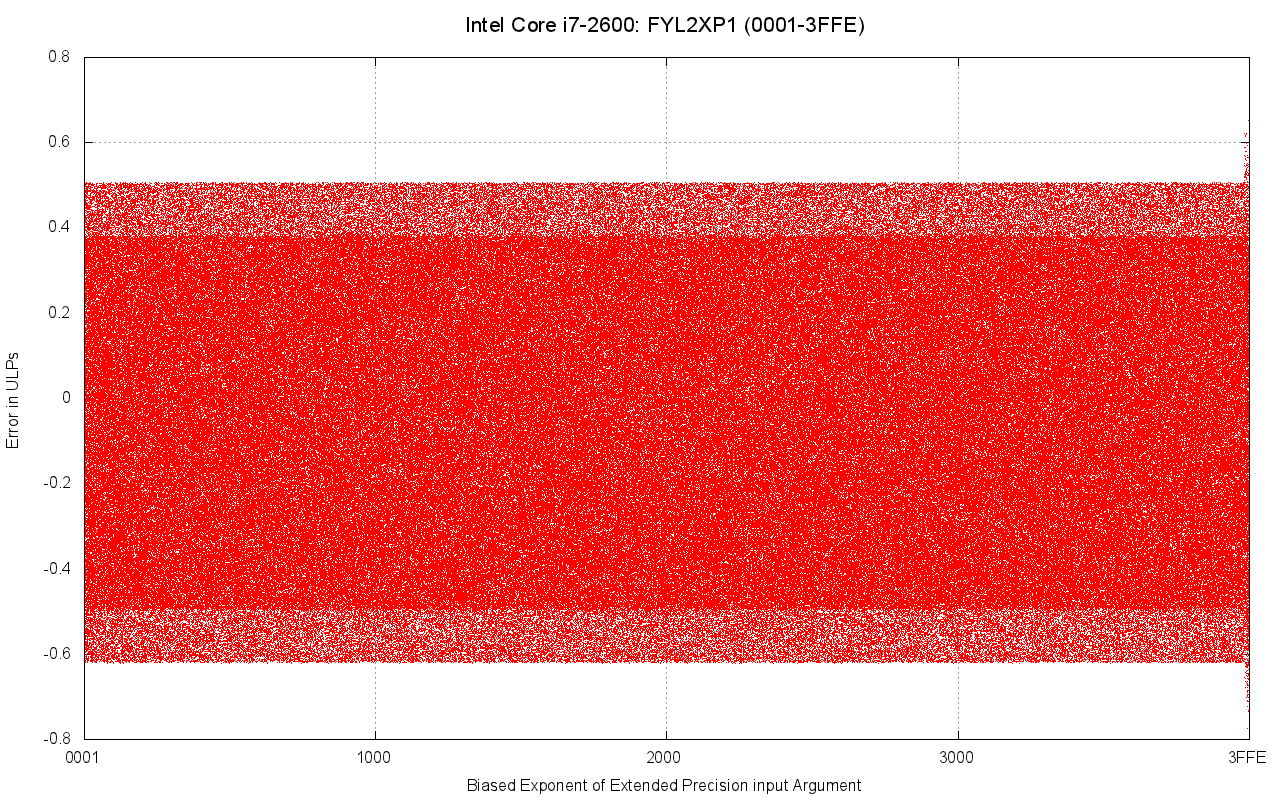
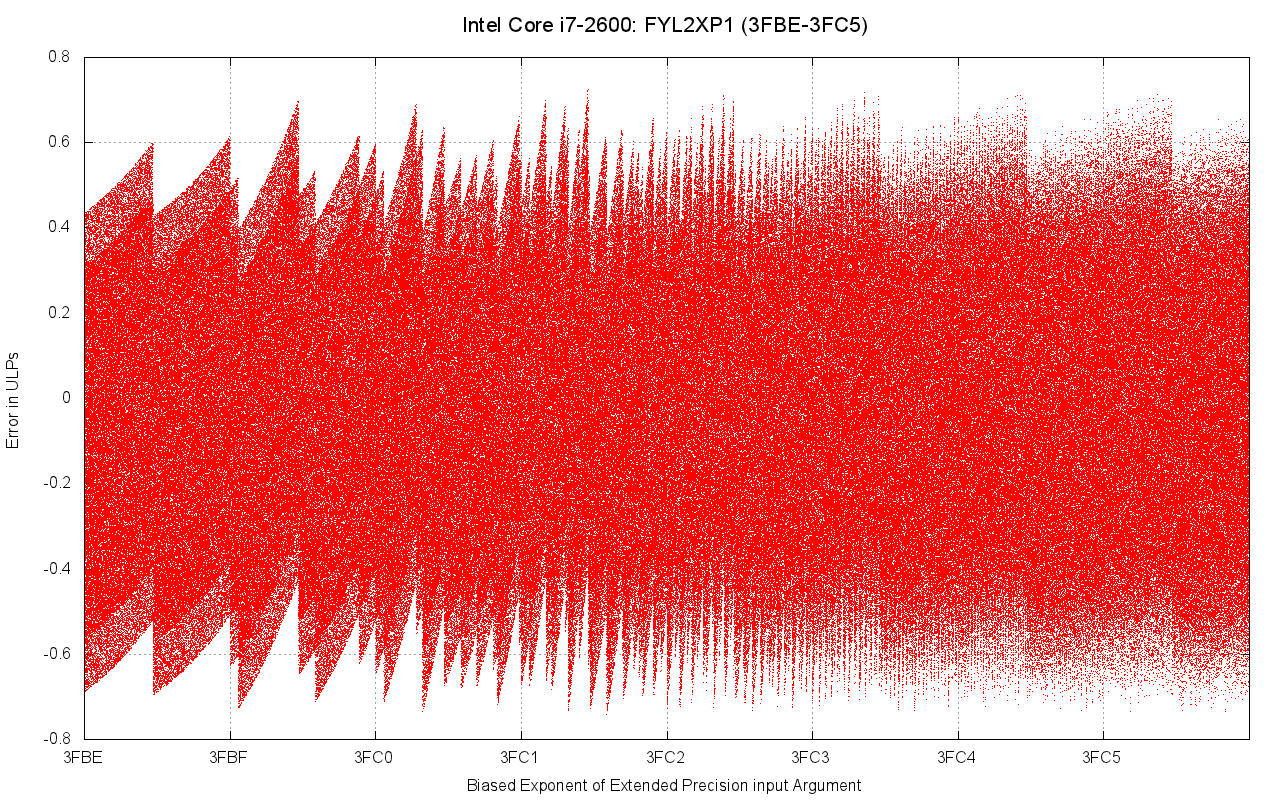
Fyl2xp1 plot for positive arguments < 1.0. No failures were found for the fyl2xp1 instruction.
Fyl2xp1 plot for argument values 2.71E-20 through 6.93E-18.
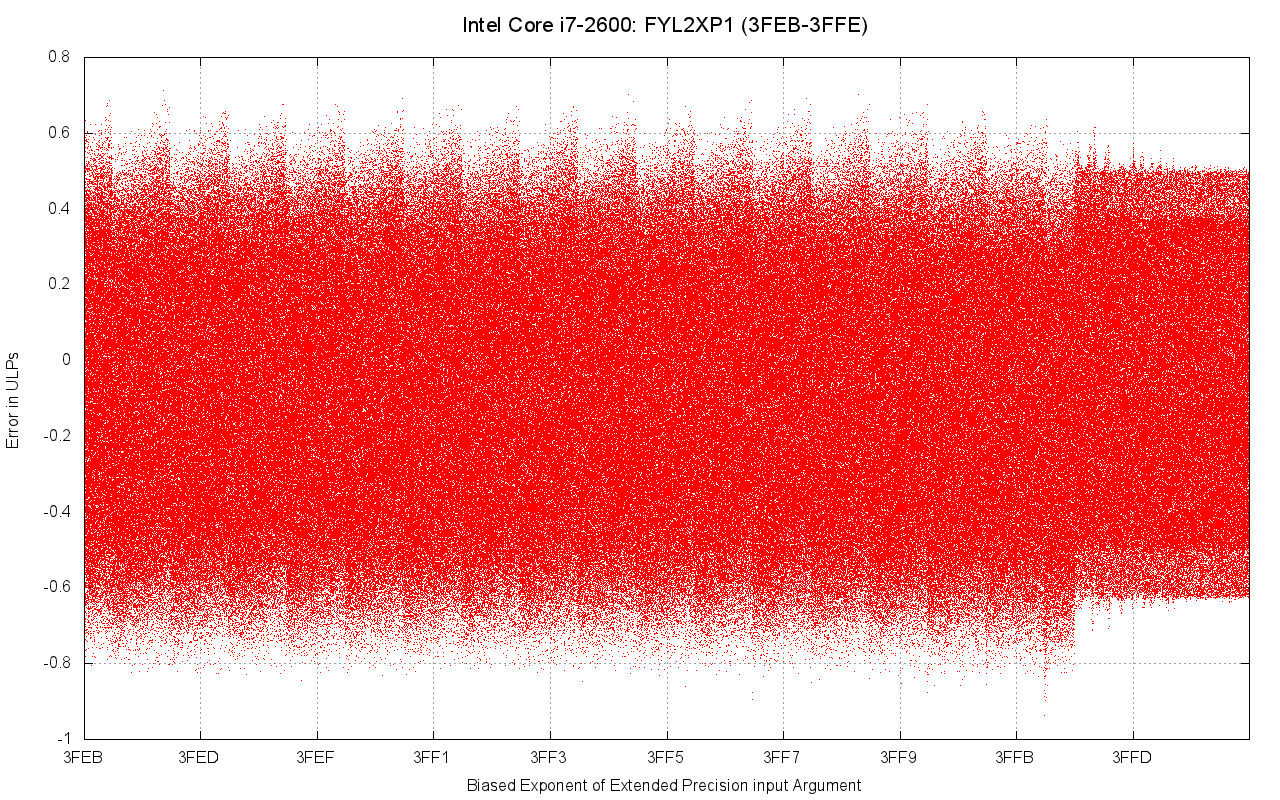
Fyl2xp1 plot for argument values near 1.0.
Fyl2x plot for argument values 1.0 through 2.0. No failures were found for the fyl2x instruction.
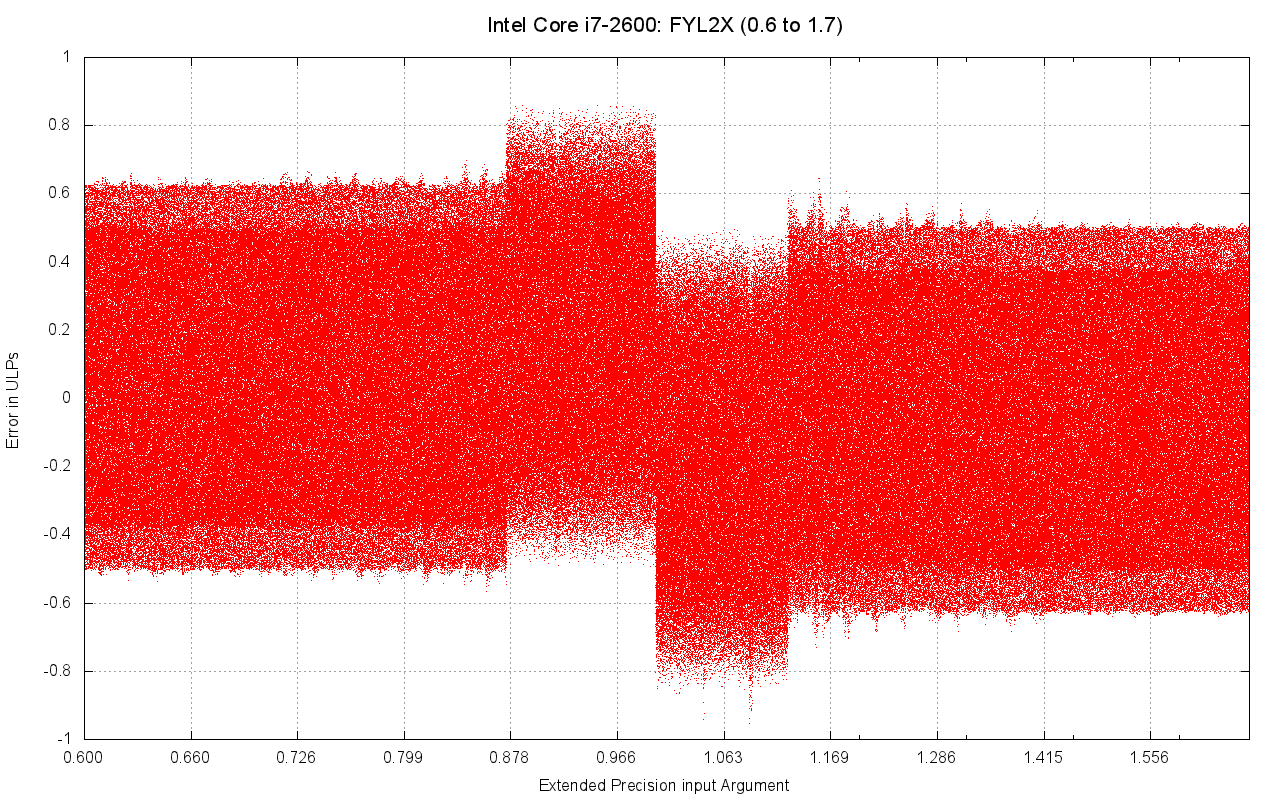
Fyl2x plot for argument values 0.6 through 1.7.
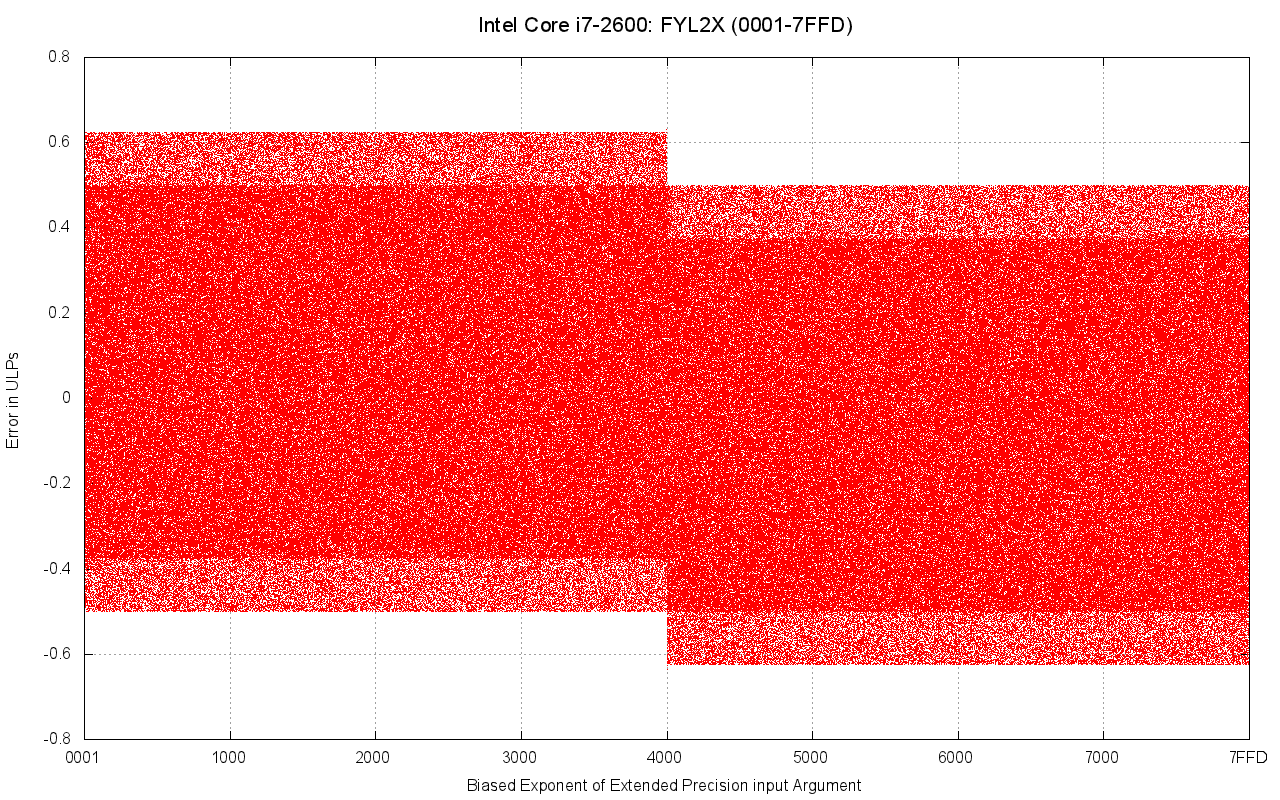
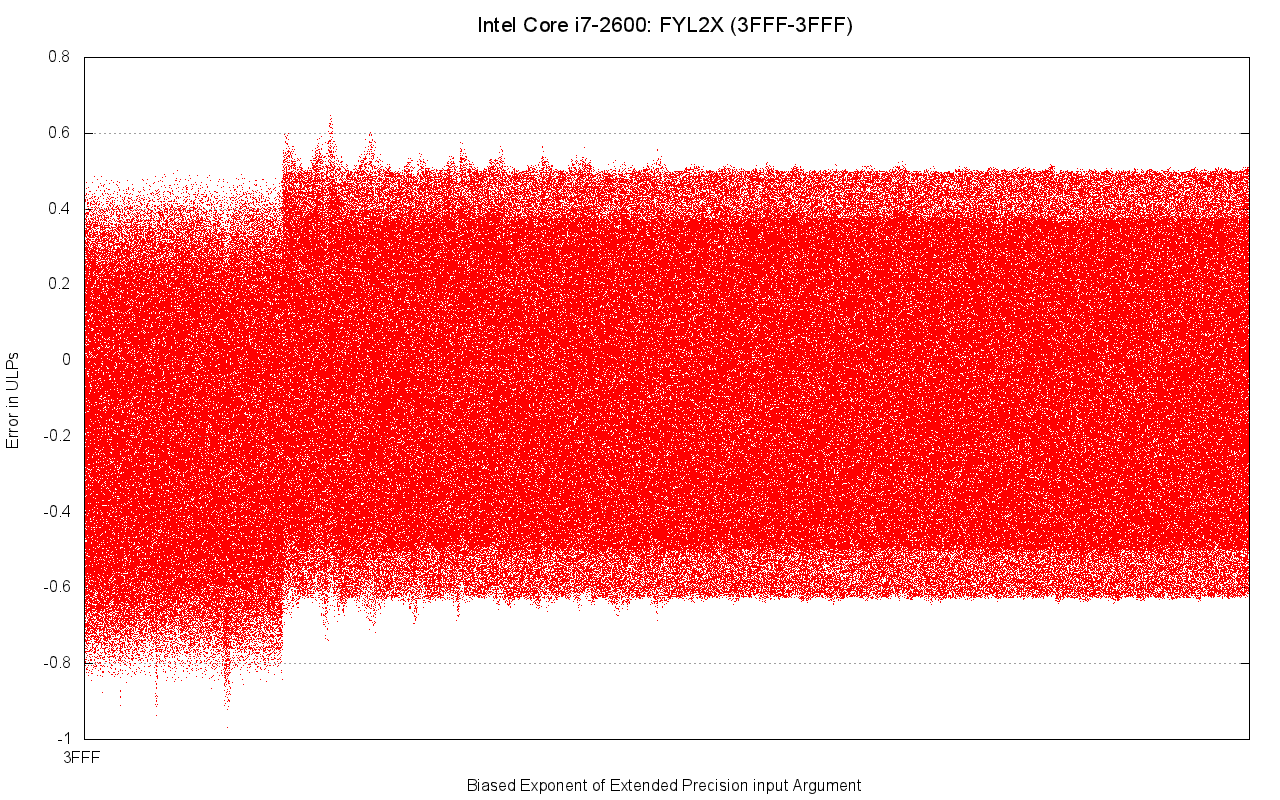
Fyl2x plot for entire argument range.